Local highway maintenance transparency report (June 2025)
Southampton's highway network
Introduction
As both a major city and a key route for tourism, our highway network is heavily used, especially during holiday periods. According to the Local Transport Plan (LTP4) over 16,000 vehicles enter the city centre every day during the morning peak, while the number of buses and bus users is rising, with 21.2 million journeys per year.
Demand for services in the city include a General Hospital together with 69 primary schools and 23 secondary schools. 33,000 pupils attend these schools with 25% of primary school pupils and 19% of secondary school pupils driven by car to the immediate vicinity of the school every day during term time.
The Port of Southampton is a major deep-sea port with national and global economic importance. It provides a gateway to global markets for businesses across much of southern and central England for the import and export of goods, with exports to non-EU markets worth £70 billion. The Port is also the busiest cruise terminal in Northern Europe, where 1.7million passengers, 86% of all cruise passengers in the UK, begin or end their cruise and second largest container port in the UK. Southampton is also a gateway to the Isle of Wight with 3.4million people traveling to the island every year by ferry.
Southampton’s main highway network is based around a limited number of routes into the city from the suburbs and the wider Hampshire area, which results in concentration of traffic flows onto these main routes. As Southampton is divided by the River Itchen in the east of the city, there is a heavy reliance on using one of the four main bridge crossings to get across the city and into the city centre.
Lengths of highways, footways and cycleways
- Principal (A) roads - 58.2km
- Classified (B and C) roads - 57.9km
- Unclassified (U) roads - 475.6km
- Total roads - 591.7km
- Footways - 1,218.8km
- Other public rights of way - 51.5km
- Cycleways - 89.3km
Being a busy, mostly urban network, traffic management systems are important to keep road users moving safely. 117 junctions are signal controlled and there are 94 signalised pedestrian crossing facilities. There are also 42 road and footbridges, and 38 subway structures managed within our Highway Service Partnership, and around 27,000 street lighting assets managed by Enerveo under the South Coast Lighting Partnership PFI (Private Finance Initiative). In addition, the network includes many complimentary assets such as road markings, traffic signs and street furniture, along with 23,200 highway drainage gullies.
Highways maintenance spending figures
Highways maintenance spending figures
| Year | Capital allocated by DfT | Capital spend | Revenue spend | Estimate of percentage spent on preventative maintenance | Estimate of percentage spent on reactive maintenance | Street Lighting PFI Revenue spend (£) |
|---|---|---|---|---|---|---|
| 2025 to 2026 projected | £3,235,000 | £4,236,000* | £3,832,861 | 32.75% (5.2 miles) | 51% | £4,575,193 |
| 2024 to 2025 | £2,396,000 | £4,197,072 | £3,724,627 | 0% | 52% | £4,646,017 |
| 2023 to 2024 | £2,775,400 | £12,318,255 | £3,580,647 | 0% | 46% | £4,508,770 |
| 2022 to 2023 | £2,128,000 | £14,980,687 | £3,172,536 | 0% | 55% | £3,163,843 |
| 2021 to 2022 | £2,128,000 | £10,608,084 | £2,945,147 | 13.2% (4.6 miles) | 54% | £3,406,869 |
| 2020 to 2021 | £3,002,000 | £7,776,212 | £2,839,893 | 0% | 53% | £3,117,881 |
* 2025 to 2026 projected Capital Spend for highways maintenance is expected to increase during the year as opportunities for redistribution of capital budgets are reviewed/approved.
Additional information on spending
1. Information about the capital funding allocations for local highways maintenance from the Department for Transport (DfT) is available at GOV.UK
2. Capital spend focuses on highway improvements and significant maintenance activities such as replacing worn road surfaces. Examples of programmed improvements and maintenance includes lower cost minor works that locally improve or upgrade infrastructure, the planned resurfacing or reconstructing of existing road, footway and cycleway surfaces, the maintenance or upgrade of bridge structures, the update or replacement of traffic management systems, and investment in new transport or highway network improvements
3. Revenue spend includes routine maintenance activities such as regular cleaning of highway drainage gullies, pre-salting roads in colder weather, cutting of grass verges etc, and reactive activities such as to repair roads and footways (including potholes), and to respond to flooding and other incidents. It also includes service inspections of bridges, structures and culverts, and regular road / footway condition surveys and assessments to inform future capital funding decisions and identify maintenance needs. Estimates of how many potholes have been filled in each of the last 5 years on roads and footways is available in the following table.
| Year | Roads | Footways | Find and Fix | Total |
|---|---|---|---|---|
| 2024 to 2025 | 2781 | 1466 | 0 | 4247 |
| 2023 to 2024 | 2856 | 755 | 137 | 3748 |
| 2022 to 2023 | 2386 | 1832 | 1526 | 5744 |
| 2021 to 2022 | 2444 | 1648 | 2045 | 6137 |
| 2020 to 2021 | 2273 | 915 | 319 | 3507 |
4. Longer term preventative maintenance involves a mix of pro-active treatments of a road or footway surface (e.g. micro-asphalt), and small repair areas (e.g. filling cracks). These are ‘capital’ funded and planned programmes of work, designed to prolong the life of road and footway surfaces by intervening early and treating defects when they are smaller and less complex. Applied at the right time treatments prevent water penetrating the surface, improving the networks resilience, and reducing the chances of potholes forming in the future. Preventative maintenance treatments typically include surface dressing, micro-asphalt, sealing cracks, and associated surface pre-patching repairs.
The use of preventative treatments on road and footway surfaces is important when balancing the need for reactive repairs (after the surface has deteriorated and potholes have formed), with earlier interventions to prevent deterioration, improve resilience and extend the life of the existing surface. Although these treatments cost less and provide good value for money over the whole life of the road or footway, the challenge to justify to stakeholders why obviously poorer roads and footways are not repaired first (i.e. a more expensive “worst first” maintenance approach), is also considered by decision makers. Determining the split between preventative and reactive maintenance initially considers the overall condition of the surface and the proportion that is damaged, alongside the use by, and the relative risk for, all users of the road or footway.
5. As well as proactively maintaining the road and footways, it is also necessary to maintain road safety and usability by responding to defects such as potholes, surface failures and structural weaknesses with ‘reactive’ repairs. Reactive maintenance is ‘revenue’ funded and categorised by agreed defect and risk parameters, and response times.
The percentage of reactive maintenance spend generally focuses on the cost to deliver the reactive maintenance service for roads and footways, and includes:
- Operational staff costs (i.e. safety inspections, works planning and supervision etc.)
- Operational works costs (i.e. road, kerb and footway repairs including potholes)
6. Street lighting assets managed by Enerveo under the South Coast Lighting Partnership PFI (Private Finance Initiative).
Condition of local roads
Overview
Regular condition surveys and analysis enable the identification of those parts of the network that are deteriorating from good (Green) condition and approaching a poor (Red) condition. In 2024:
- 24% of the roads are in Good (green) condition and do not require maintenance (a decrease of 1.4% from the previous year)
- Roads in Fair (amber) condition have generally deteriorated to requiring maintenance soon. 66% (about 235 miles) of the roads are in amber condition (1.7% poorer than 2023)
- Roads in Poor (red) condition have deteriorated to the point they need repair. The assessed condition suggests 10% (about 36 miles) of our roads need immediate funding

Road condition assessments on the local classified road network in England have previously been completed predominantly using a surface condition assessment designed for the national network of roads – i.e. (SCANNER) laser-based technology.
The number of parameters measured in these surveys are used to produce a road condition indicator which is categorised into 3 condition categories:
- green – no further investigation or treatment required
- amber – maintenance may be required soon
- red – should be considered for maintenance
In 2026 a new methodology will be implemented nationally - the British Standards Institution ‘PAS2161’ Road Condition Monitoring Standard. Local Highway Authorities will be required to use a supplier that has been accredited against PAS2161. This new standard will categorise roads into 5 categories instead of 3 to help government gain a more detailed understanding of road condition in England.
The 5 condition categories
The 5 condition categories will be:
| Category | Description | Potential maintenance treatment option |
|---|---|---|
| 1 | No deterioration | Road is not considered for maintenance |
| 2 | Minor (and/or aesthetic) deterioration | Light maintenance - for example, minor patching |
| 3 | Moderate deterioration | Localised intervention or mid-life preventative maintenance - for example, surface dressing, patching, crack sealing |
| 4 | Moderate to severe deterioration | Rehabilitative maintenance, perhaps full carriageway - for example, resurfacing with thin overlay/surface dressing and multiple patching, edge haunching |
| 5 | Severe deterioration | Structural maintenance - for example, full carriageway resurfacing or reconstruction |
Southampton City Council has already moved to the collection and analysis of road condition assessed using these 5 condition categories. Since 2022 this approach has enabled relative maintenance priorities to be identified across all roads, using the information to monitor condition and support decisions about highway infrastructure maintenance funding needs.
Road Condition Trends
Overall, the roads in Southampton are deteriorating each year.
The length of roads in Grade 3 (Moderate deterioration) is increasing and the amount of road surface with no deterioration (i.e. Grade 1), decreasing.
The length of road surface assessed to be Grade 5 with severe deterioration is not increasing, but roads with moderate to severe deterioration (Grade 4) are increasing.
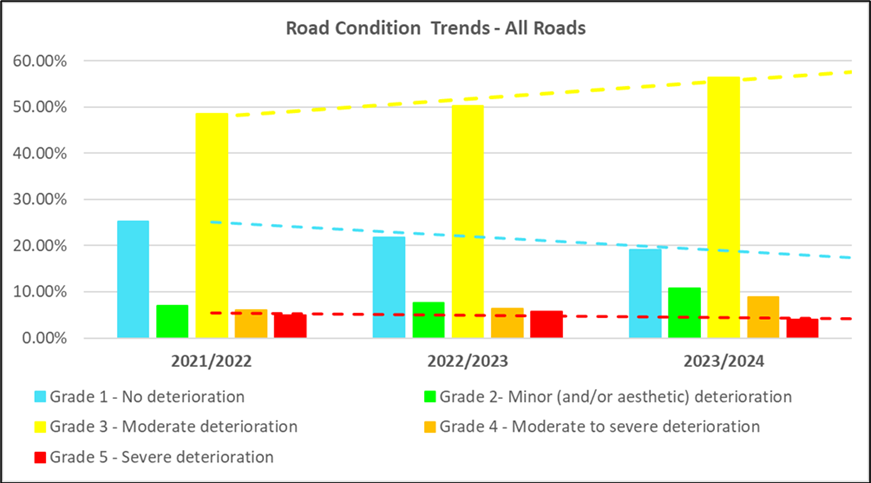
Currently, around 70% (235 miles) of the roads in the city need capital funding to complete preventative maintenance (surface treatment / patching), rehabilitative maintenance (resurfacing or overlay), or structural maintenance (resurfacing or reconstruction).

Condition of local roads (continued)
Annual assessment of Southampton's road network
The following set of information outlines the annual assessment of Southampton’s road network, including the percentage of roads in each condition, from 2020. This information is shared with the Department for Transport each year and published with other local authority’s road condition data statistics.
Percentage of A roads in each condition category (2020 to 2023) (SCANNER Survey)
| Year | Percentage of A roads in green category | Percentage of A roads in amber category | Percentage of A roads in red category |
|---|---|---|---|
| 2020 | 67% | 29% | 5% |
| 2021 | 71% | 25% | 4% |
| 2022 | 68% | 28% | 4% |
| 2023 | 69% | 27% | 4% |
Percentage of A roads in each condition category by road area (2022 to 2024) (GAIST Survey)
| Year |
No deterioration Category 1 |
Minor (and/or aesthetic) deterioration Category 2 |
Moderate deterioration Category 3 |
Moderate to severe deterioration Category 4 |
Severe deterioration Category 5 |
|---|---|---|---|---|---|
| 2022 | 34.48% | 7.26% | 49.95% | 3.87% | 4.4% |
| 2023 | 29.72% | 6.73% | 54.26% | 4.03% | 5.25% |
| 2024 | 27.61% | 8.08% | 55.94% | 5.57% | 2.80% |
All A Roads in the city are surveyed and their condition assessed each year.
Percentage of B and C roads in each condition category (2020 to 2023) – (SCANNER Survey)
| Year | Percentage of B & C roads in green category | Percentage of B & C roads in amber category | Percentage of B & C roads in red category |
|---|---|---|---|
| 2020 | 79% | 19% | 3% |
| 2021 | 80% | 18% | 3% |
| 2022 | 78% | 20% | 3% |
| 2023 | 80% | 18% | 2% |
Percentage of B and C roads in each condition category by road area (2022 to 2024) (GAIST Survey)
| Year |
No deterioration Category 1 |
Minor (and/or aesthetic) deterioration Category 2 |
Moderate deterioration Category 3 |
Moderate to severe deterioration Category 4 |
Severe deterioration Category 5 |
|---|---|---|---|---|---|
| 2022 | 31.31% | 4.55% | 52.26% | 4.87% | 7.01% |
| 2023 | 26.75% | 5.40% | 53.67% | 5.46% | 8.72% |
| 2024 | 25.18% | 6.70% | 54.71% | 7.77% | 5.65% |
All B and C Roads in the city are surveyed and their condition assessed each year.
Percentage of U roads in the red condition category (Course Visual Inspection – CVI)
- 2020 - 14%
- 2021 - 8%
- 2022 - 15%
- 2023 - 11%
Percentage of U roads in each condition category by road area (2022 to 2024) (GAIST Survey)
| Year |
No deterioration Category 1 |
Minor (and/or aesthetic) deterioration Category 2 |
Moderate deterioration Category 3 |
Moderate to severe deterioration Category 4 |
Severe deterioration Category 5 |
|---|---|---|---|---|---|
| 2022 | 25.68% | 8.22% | 46.06% | 11.22% | 8.82% |
| 2023 | 21.96% | 9.13% | 46.81% | 12.04% | 10.06% |
| 2024 | 16.40% | 12.14% | 49.21% | 16.16% | 6.09% |
All U Roads in the city are surveyed and their condition assessed each year.
Since 2022 the unclassified road network has been surveyed at the same time as the Principal (A Road) and Classified (B and C Roads) using 360° vehicle mounted camera imagery to assess the surface condition. This alignment of road condition data has allowed the different road classifications to be assessed in the same way meaning road maintenance funding can be allocated more consistently and effectively across the whole network.
Plans
Overall strategy
The approach to managing highway infrastructure assets supports the focus on improving the efficiency of transport corridors and places, making it easier for people to get about by a range of different travel choices. We strive to continually improve the effective maintenance of all highway infrastructure in Southampton within the available funding resources.
Southampton’s highway infrastructure is essential to enabling the strategic goals and supporting the themes of Connected Southampton. Connected Southampton is the umbrella transport planning document for the city. It consists of component parts that together provide the Local Transport Plan for Southampton that is supported by the strategic approach to asset management.
The strategy is delivered within a highway asset management framework that establishes the activities and process to develop, document, implement and continually improve highway maintenance services in Southampton. Aligned to the Council’s objectives, this strategy informs the Highway Infrastructure Asset Management approach and the funding decisions that are annually considered for the Forward Programme and Annual Plan maintenance priorities.
Each year an Annual Plan is developed against a range of funding scenarios and the core service areas expected to be delivered by the Council’s service providers the following year. In 2024/25 uncertainty over the capital settlement due to the pressures on the Council’s budgets and lower levels of funding for highway infrastructure maintenance meant an emergency / statutory minimum service Road Repairs Strategy was used to identify maintenance priorities. This approach has been followed again when preparing the 2025/26 Annual Plan.
Best Practice, Innovation and Efficiency
Within an integrated asset management approach, services are delivered predominantly with our principal specialist supply chain partners (Balfour Beatty and Enerveo), alongside our in-house teams. These contractual service delivery arrangements have established levels of service aligned to the agreed risk-based strategy. The effective delivery of highway maintenance services is managed within a governance framework of operational, budgetary and senior management boards ensuring an efficient use of resources and funding, focused on agreed outcomes.
Southampton City Council and our main supplier are members and corporate members of the Local Council Roads Innovation Group (LCRIG). By regularly engaging with LCRIG events, and the latest industry best practices and innovations, opportunities for service improvements are considered as part of a continuous improvement to drive collaboration, innovation and skills development for the benefit of residents, visitors and businesses that rely on the roads in the city.
Specific plans for 2025 to 2026
The major reductions in the Council’s 2024/25 funding and an anticipated “Low” funding level of SCC Highways Capital funding in 2025/26 meant preparing an Annual Plan against an ‘emergency/statutory minimum service’ budget for a second year. This funding level doesn’t support the programming of larger road (or footway) resurfacing schemes during 2025/26.
The limited funding allocation for the maintenance of road surfaces is being focused on prioritising the worst of the City’s highways network deterioration through targeted road repairs, alongside a pro-active preventative maintenance programme to improve resilience and extend the life of existing residential unclassified roads before they deteriorate too far.
Within these funding constraints it is anticipated the relative spend between planned preventative maintenance and reactive works in 2025/26 will be around a ratio of 0.7:1
This year (2025 to 2026) it is planned to resurface and repair 3.5 miles and surface treat almost 4 miles of the roads in Southampton. 1.4 miles of footway surfaces will also be treated and repaired. The strategically important Itchen Toll Bridge will also see significant additional investment to renew highway drainage, waterproofing and reconstruct over 1 mile of footway surfaces, and resurface over ½ mile of the bridge’s road surface.
It is predicted around 4,400 potholes will be filled across the highway network during 2025/26.
Estimate of number of potholes we will fill during 2025/26
2025 to 2026
- Roads - 3000
- Footways - 1400
- Total - 4400
Streetworks
Southampton City Council recently conducted a review of the traffic data and traffic route sensitivity and identified that there is justification and business case for a Lane Rental Scheme on key routes in the city. The proposed Lane Rental Scheme, if approved by the Secretary of State, will give a further level of control for the Southampton networks most strategic and critical routes. This will incentivise works promotors to undertake their activities outside of traffic sensitive times, take advantage of collaborative workings, and use innovative techniques to minimise occupancy durations. It will also strongly encourage and incentivise ‘right first time’ and ‘future proof’ works reducing the likelihood of return visits to a location for remedial works or future improvements.
The current Streetworks permitting scheme is reviewed annually to demonstrate that the authorised functions are being managed within the legalisation, and to optimise and coordinate all parties working on the road network, including both highway authority and statutory undertaker work. The review of, and granting, refusing, or imposing conditions on proposed Streetworks requests limits impacts to the network users and co-ordinates timings for roadworks, whilst still trying to give works promotors equal and fair opportunities for them to undertake maintenance and improvement to their pipes, cables and service assets (either planned or unplanned).
Climate change, resilience and adaption
Southampton City Council’s Green City Action Plan 2023 – 2030 sets out how we will become a net zero city and tackle the challenges of climate change.
Actions have been divided into the following groups against the plan’s key themes under an overarching theme of Governance:
Key themes
- Monitoring & measuring
- Involving communities of all sorts
- Maintain, enhance & protect
- Expertise, skills & development
- Finance mechanisms
- Policy & regulation
Areas of action
- Sustainable energy and carbon reduction - Use energy that is generated from renewable sources and support the generation of sustainable energy that does not compromise local air quality
- Air quality - Actions that will improve the quality of life in our city
- Natural environment - Improving resilience of habitats to a changing climate
- Resources, waste and water management - To tackle climate change we need to consider the best use of our resources including energy and water conservation and implementing a circular economy
- Sustainable transport - Encourage, promote and incentivise the use of sustainable and active travel
Supporting how and when we will achieve the aims and objectives set out in the Green City Action Plan, our primary highway maintenance service provider is actively delivering services within their own Building New Futures Sustainability Strategy.
This strategy focuses on six areas and sets out commitments to protect and enhance the environment and leave a positive social legacy:
- Climate change
- Nature positive
- Resource efficiency
- Supply chain integrity
- Community engagement
- Employee diversity, equity & inclusion
Operational improvements in this area have included:
- Improving whole life costs of highway infrastructure maintenance and reducing the whole life carbon by increasing preventative treatments on roads and pavements
- Increased use of grouted asphalt that reduces carbon by about 40%
- Specifying warm mix asphalt materials as a default when resurfacing and repairing roads and pavements
- As part of maintenance operations concrete waste (kerbs and paving slabs etc.) are crushed for recycling, and asphalt materials graded and recycled, at external specialist waste facilities, for reuse in new materials. Last year over 99% of our construction waste was diverted from landfill.
- Safety Inspector/management transport is either EV or Hybrid – we have 10 fully electric vans used for inspections.
- Maintenance plant and equipment is moving toward being electric powered wherever practical, with ongoing trials of electric plant to replace petrol/diesel plant.